Weather station photo
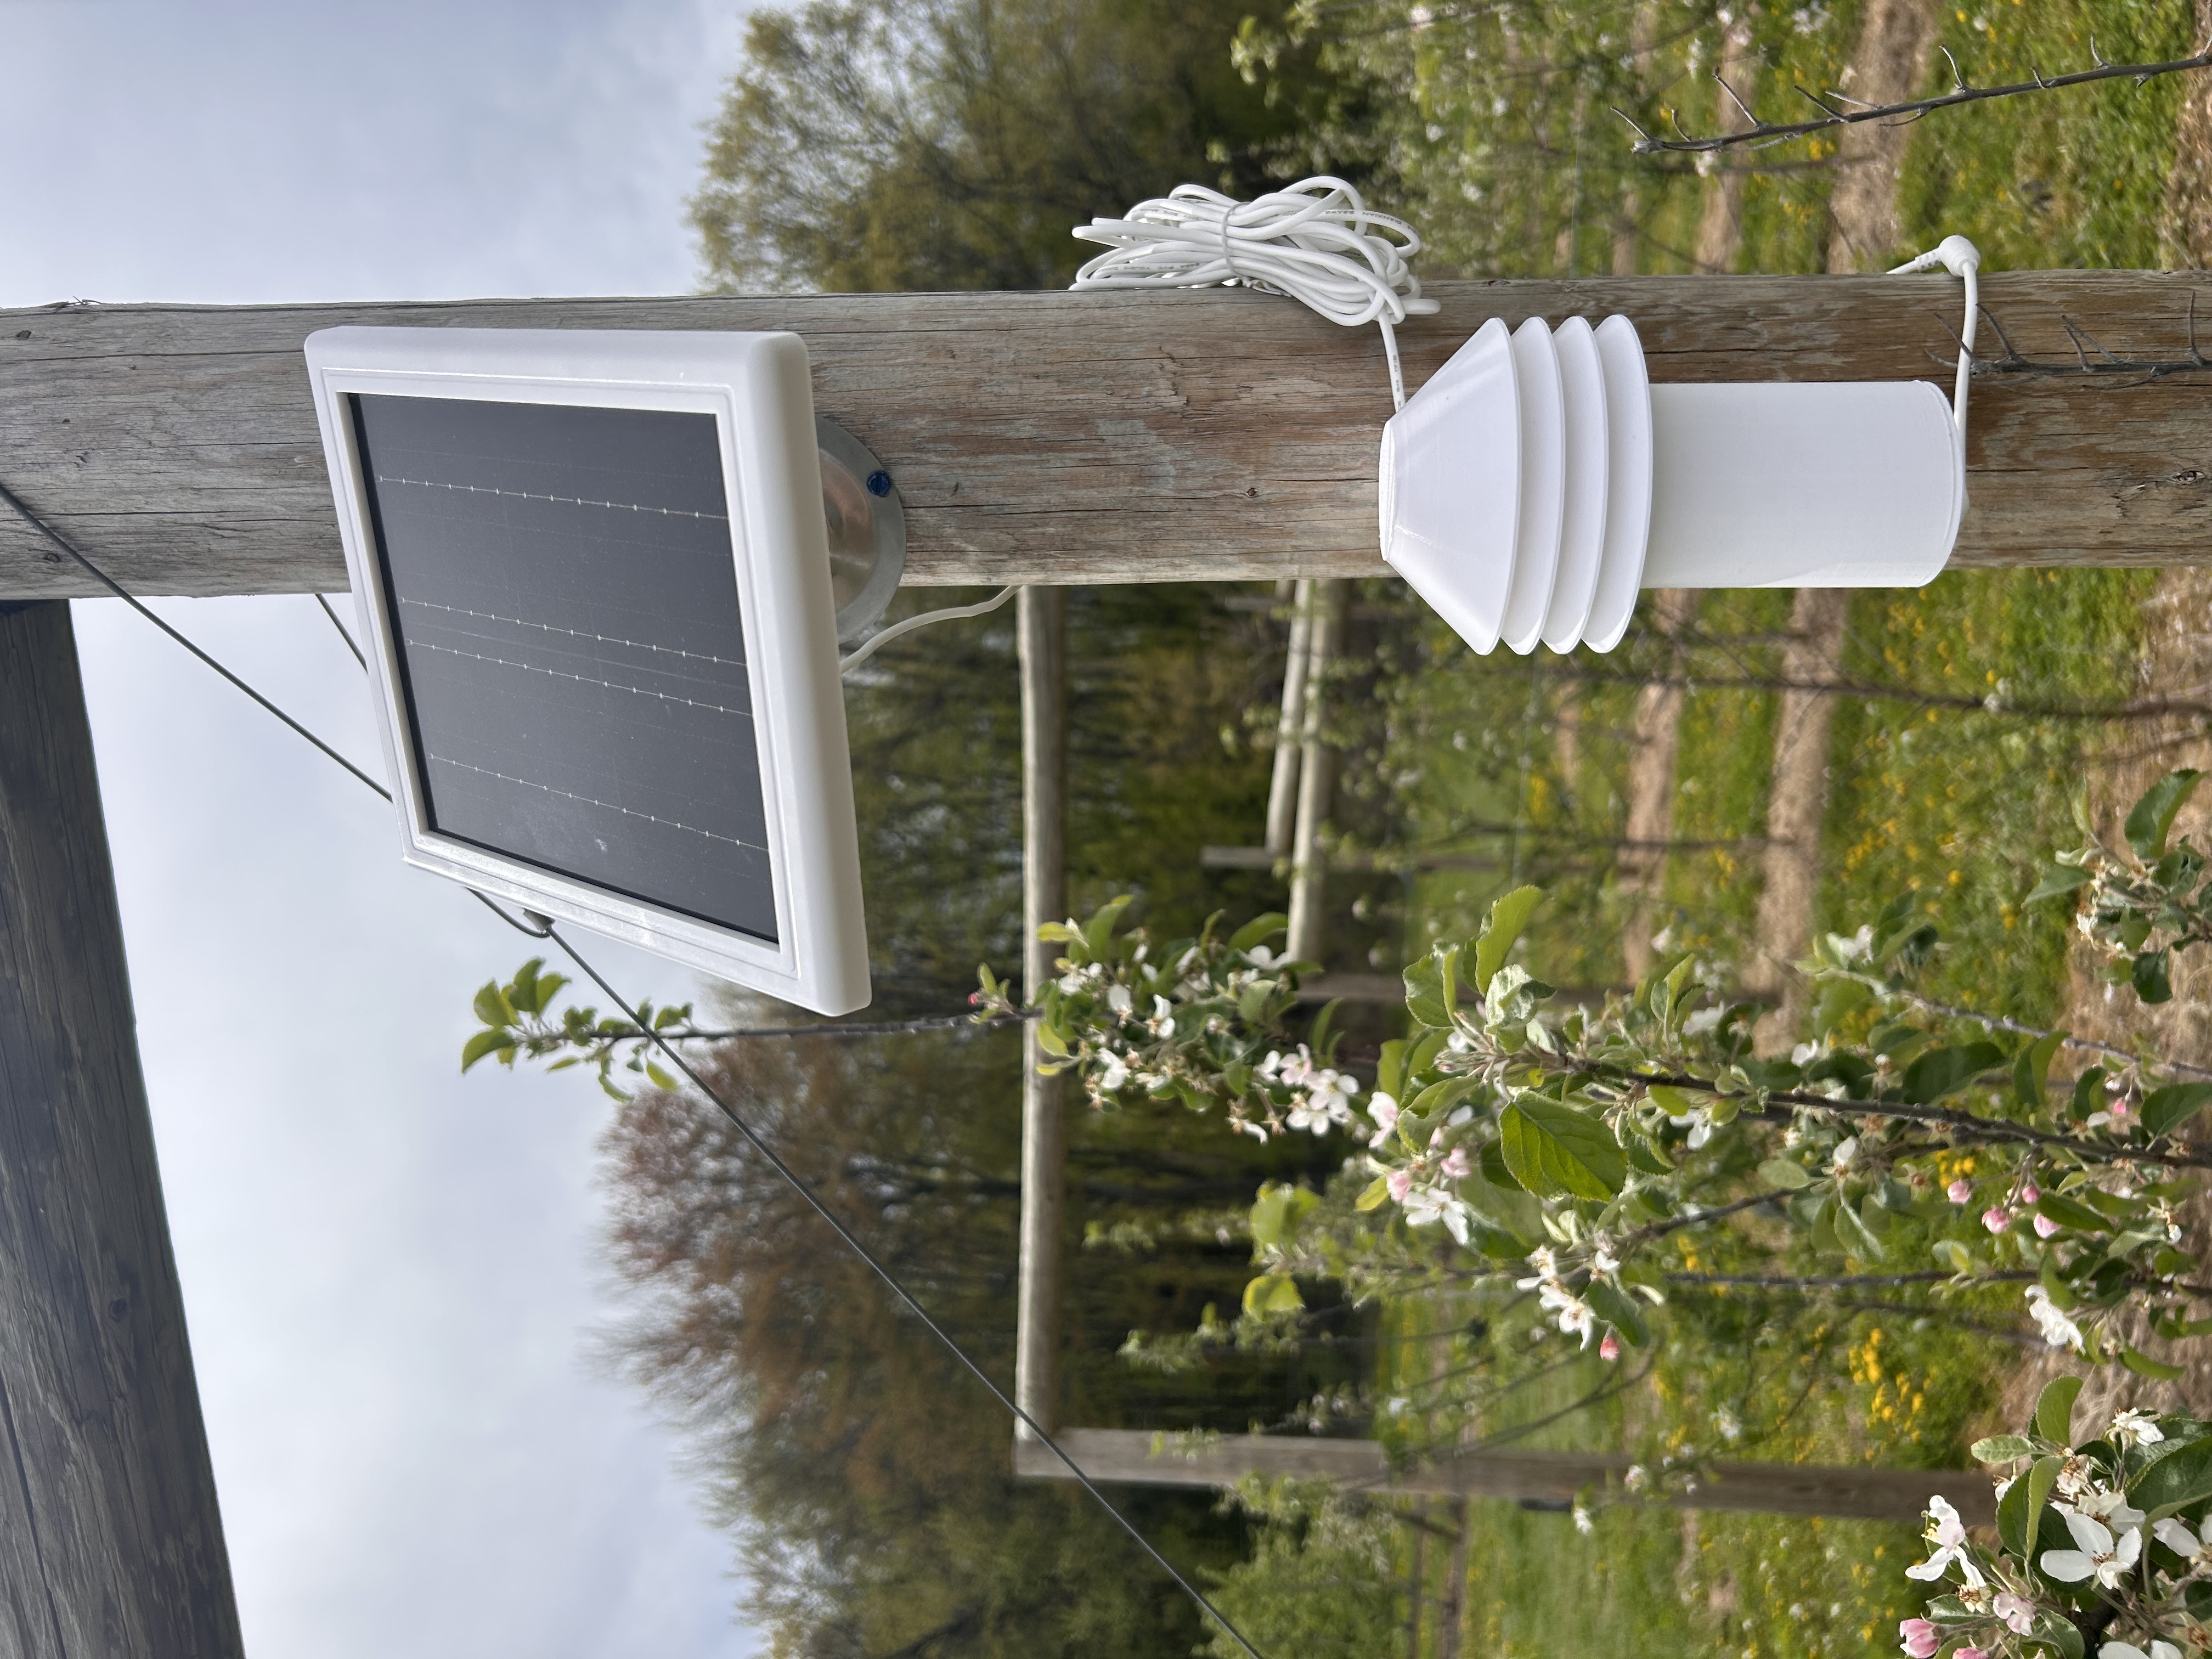
This dashboard shows live-updated data from temperature, relative humidity, and leaf wetness data from custom weather stations. The weather stations are esp32 LoRa boards connected to sht-45 temperature/relative humidity and phytos 31 leaf wetness sensors.
Three small studies are currently being conducted with microclimatic sensors placed in unique areas to study changes in disease pressure.
Figure. Temperature and relative humidity are both highly correlated with plant fungal disease development.
Figure. Leaf wetness duration, in combination with temperature are two key metrics for disease development. This leaf wetness duration is informed by leaf wetness sensors or can be approximated by relative humidity being greater than 90%. In general, longer LWD values relate to increased disease infection risk.
Figure. Current experiments are underway for validating the use of models that use temperature and LWD for predicting risk of bitter rot disease of apple. The curve shown uses the Cosseboom (2024) DF2-NN model from Cosseboom and Hu 2022 (trained with LWD up to 24 h). Risk above 0.45 is considered high. This model has also been validated for predicting ripe rot of grapes and is implemented in NEWA.
Figure. Current experiments are underway for validating the use of models that use temperature and LWD for predicting risk of bitter rot disease of apple. One model is implemented in this dashboard from Wilson et al. 1990, which has also been found to be useful for predicting diseases caused by Colletotrichum spp. in other crops. Risk above 0.15 is considered moderate, and risk above 0.5 is considered high.
Leaf wetness duration and the bitter rot risk chart use “wet” vs “dry” from your packets. Choose per station whether wetness follows PHYTOS31 (≥ 365 mV when present; otherwise RH ≥ 90%) or RH only (≥ 90%, ignores PHYTOS).
| Received | Node | Seq | Temp | RH | VBAT | Phytos31 | SD | RSSI | SNR | Payload |
|---|
Photos from the LoRa weather station deployments and microclimate experiments. Click any image to enlarge it.